A self-hosted observability tool for your applications' errors and uptime. It catches every error across your PHP, JavaScript, WordPress and OpenTelemetry services the moment it happens, groups them into issues, and alerts the right team — all running on infrastructure you control, so your data never leaves it. No per-event bill, no third party in the path.
See what's breaking, why, and where — in one fast dashboard you host yourself, with no monthly bill that grows with your traffic.
The moment something goes wrong, it's recorded and ready to look at. Even a sudden flood of errors won't slow your app down — it keeps serving your users while the console quietly takes everything in.
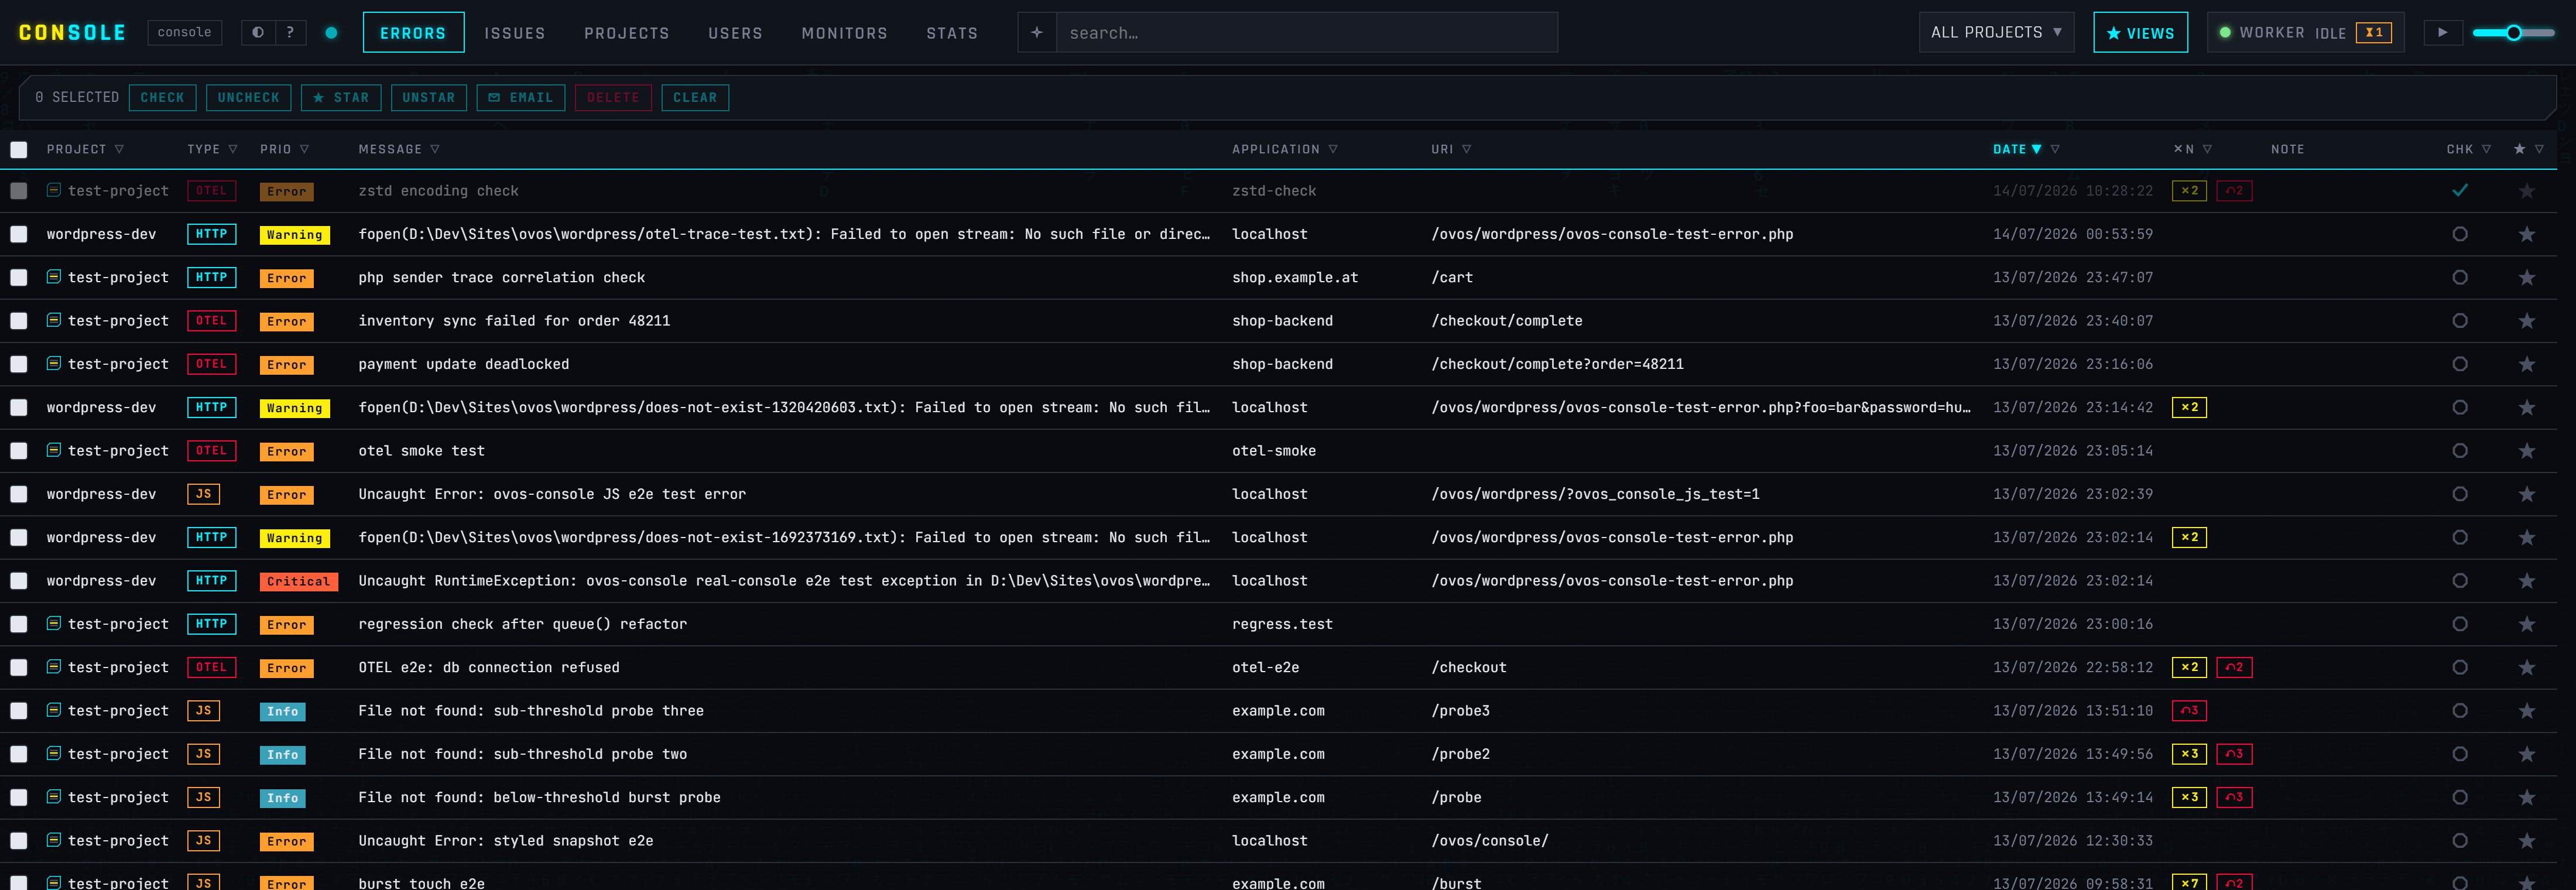
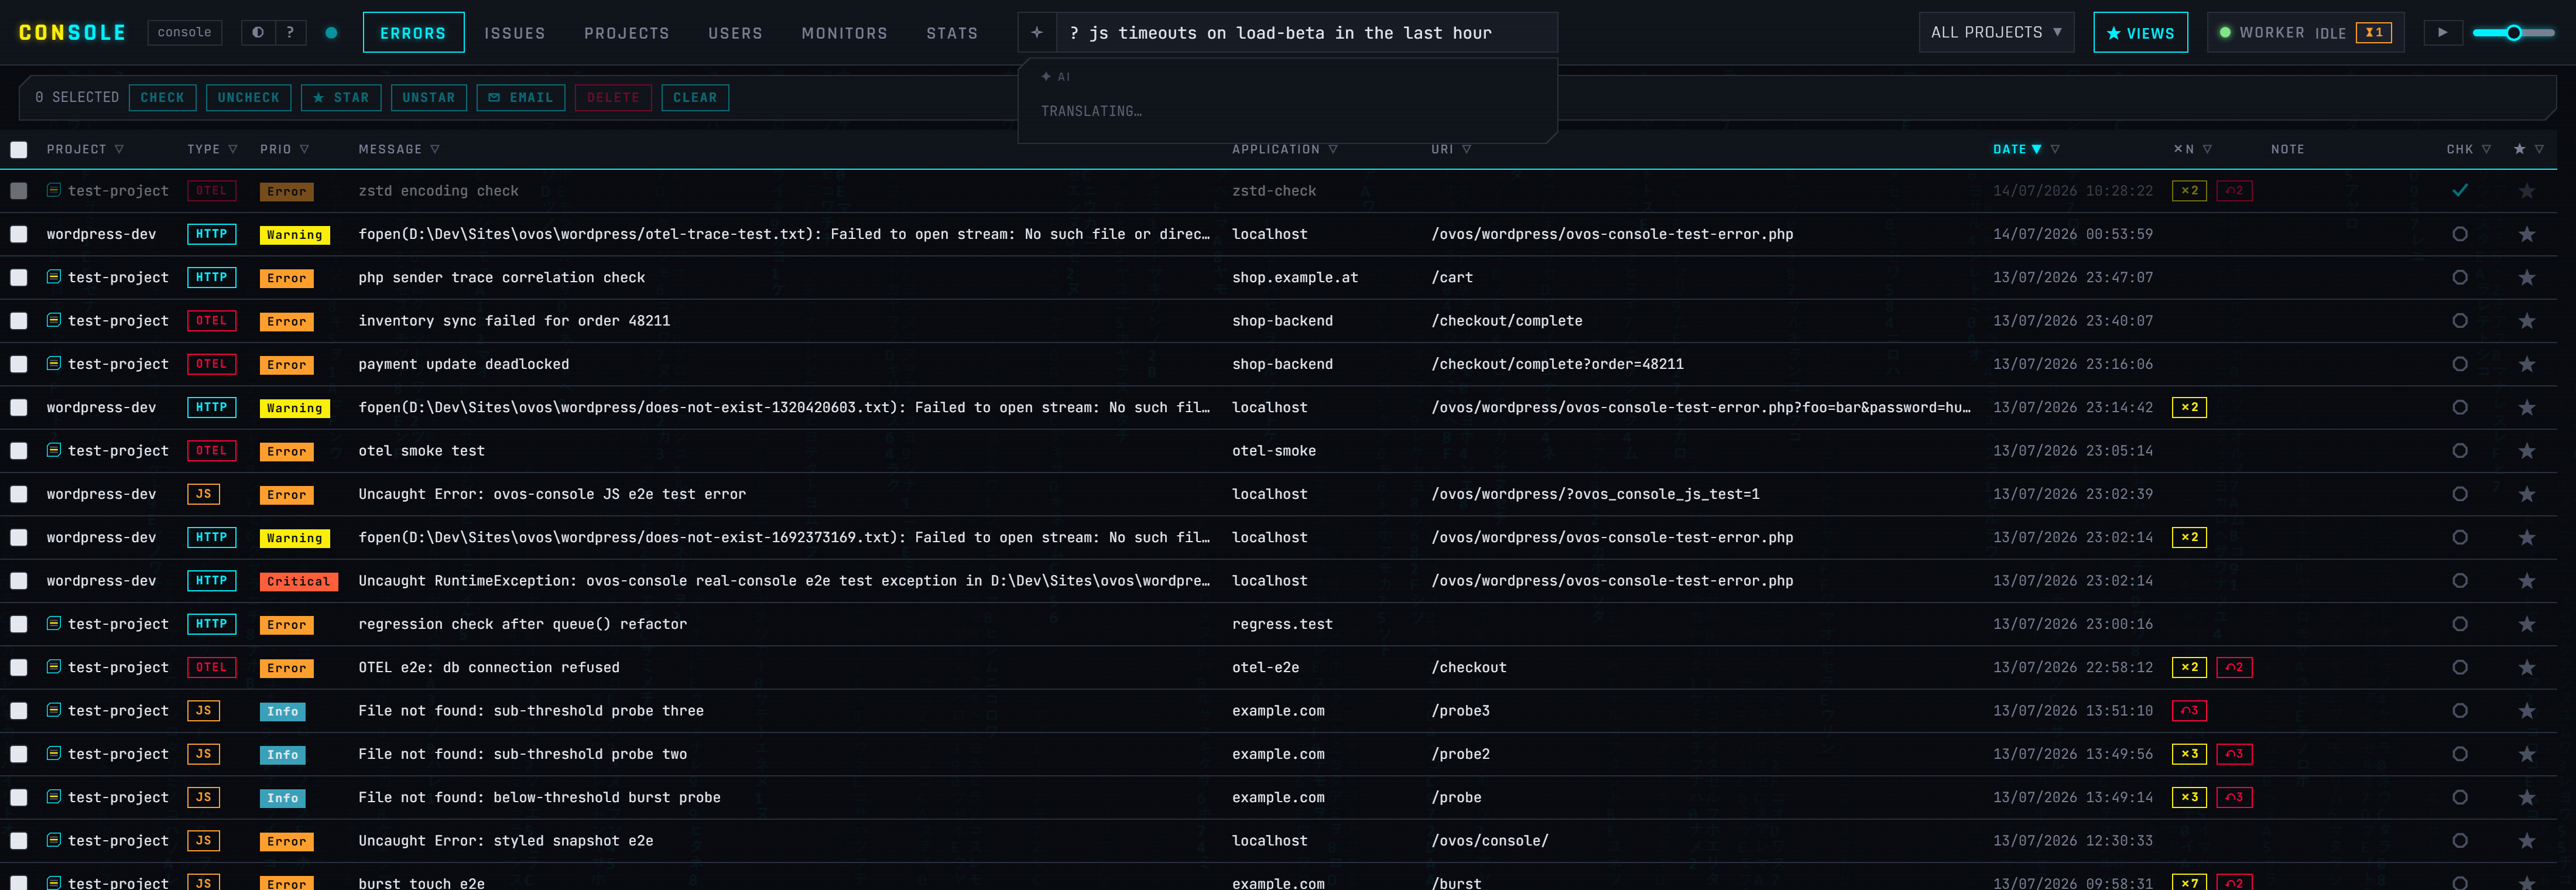
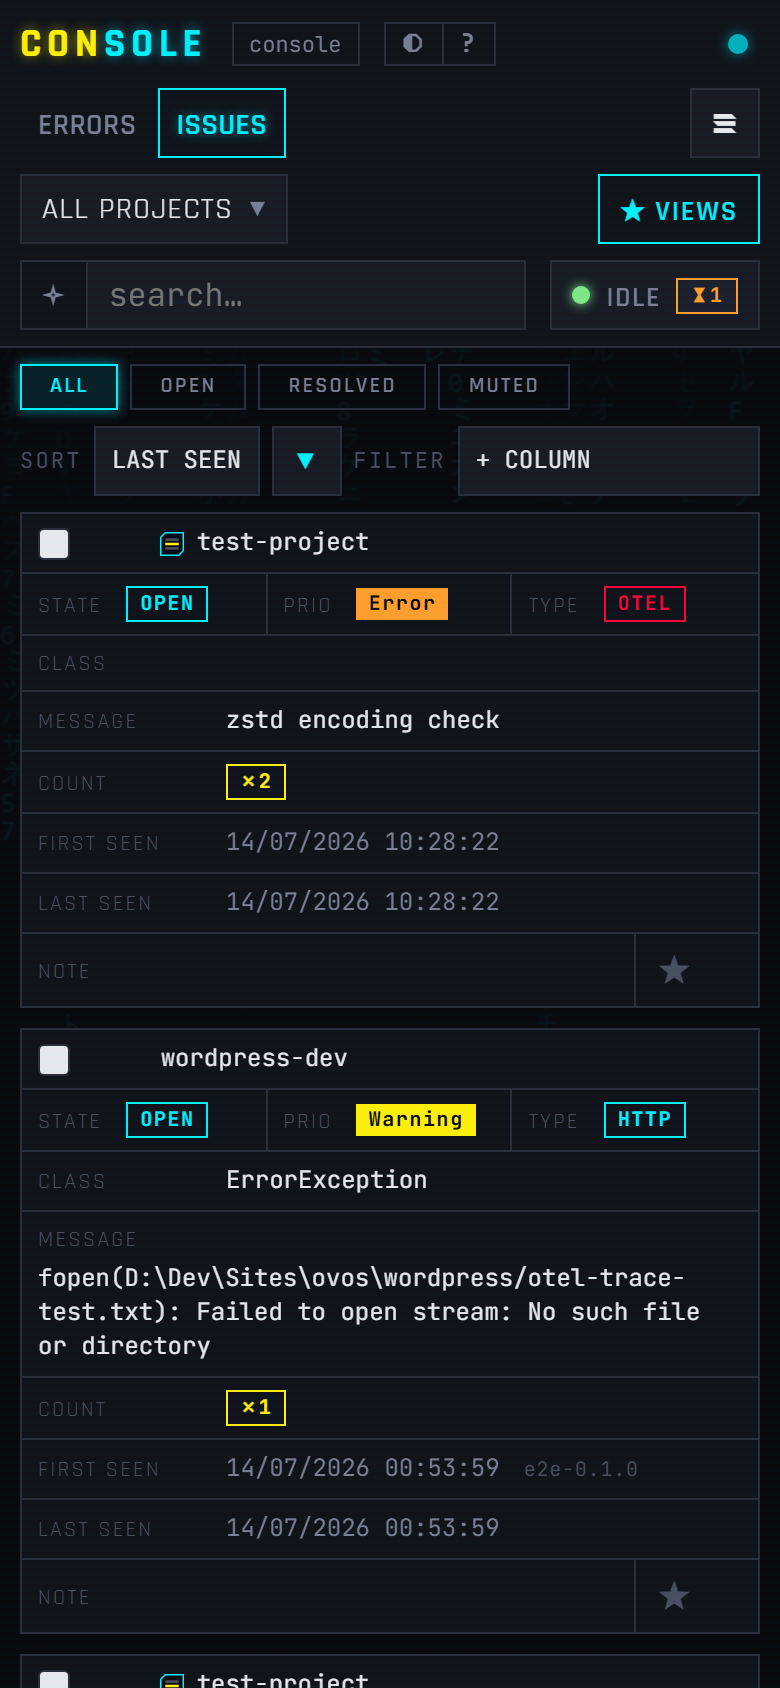
Search and filter a live list by project, type, urgency, app or server — or just type what you're looking for. Chasing one broken request across several services? A single click lines up every related error.
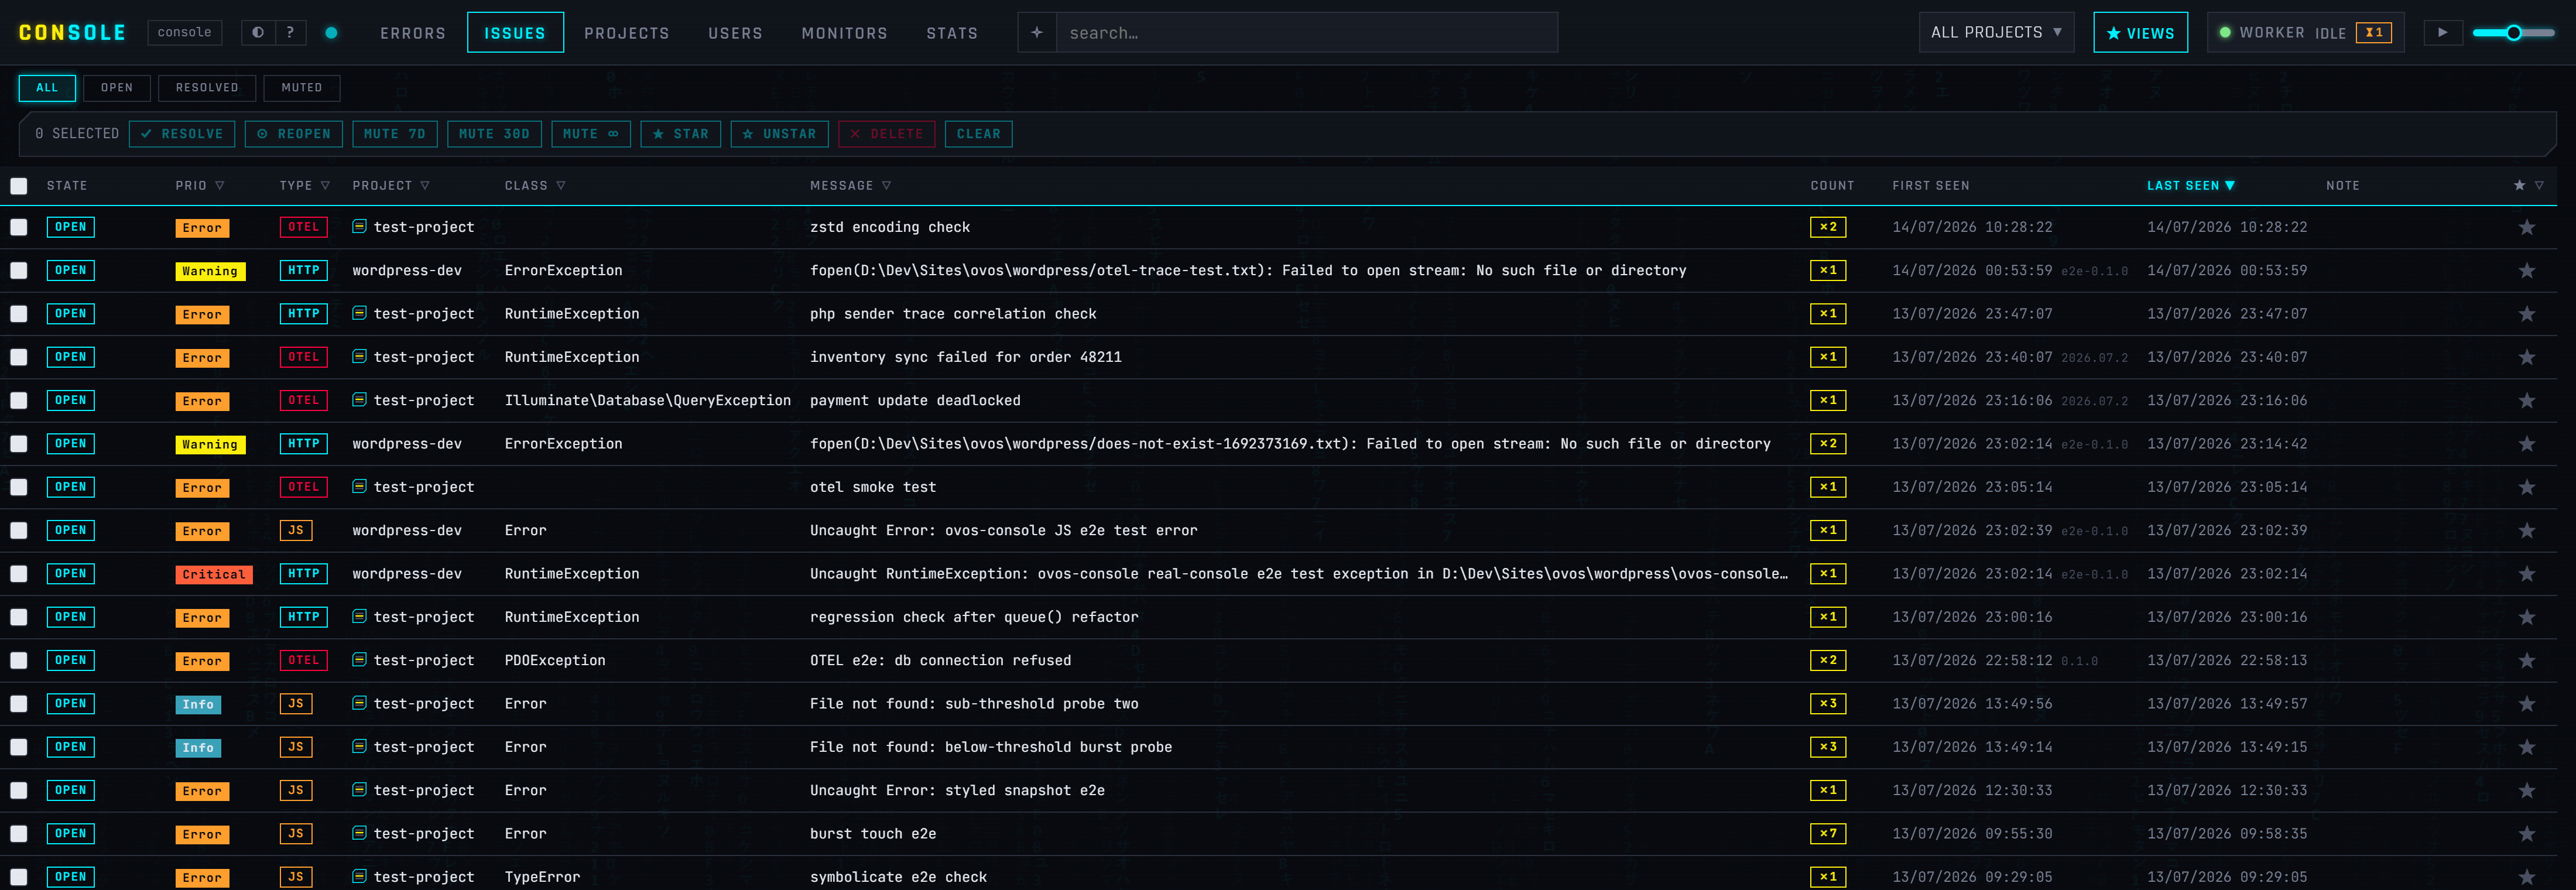
The same error happening a thousand times becomes one line, not a thousand — so the problems that matter stand out. Even a runaway loop firing tens of thousands of times collapses into a single tidy row with a count.
Collect errors from PHP, Node.js, websites, WordPress and OpenTelemetry apps — with a small drop-in library, a code snippet, or our WordPress plugin. One place for your whole stack.
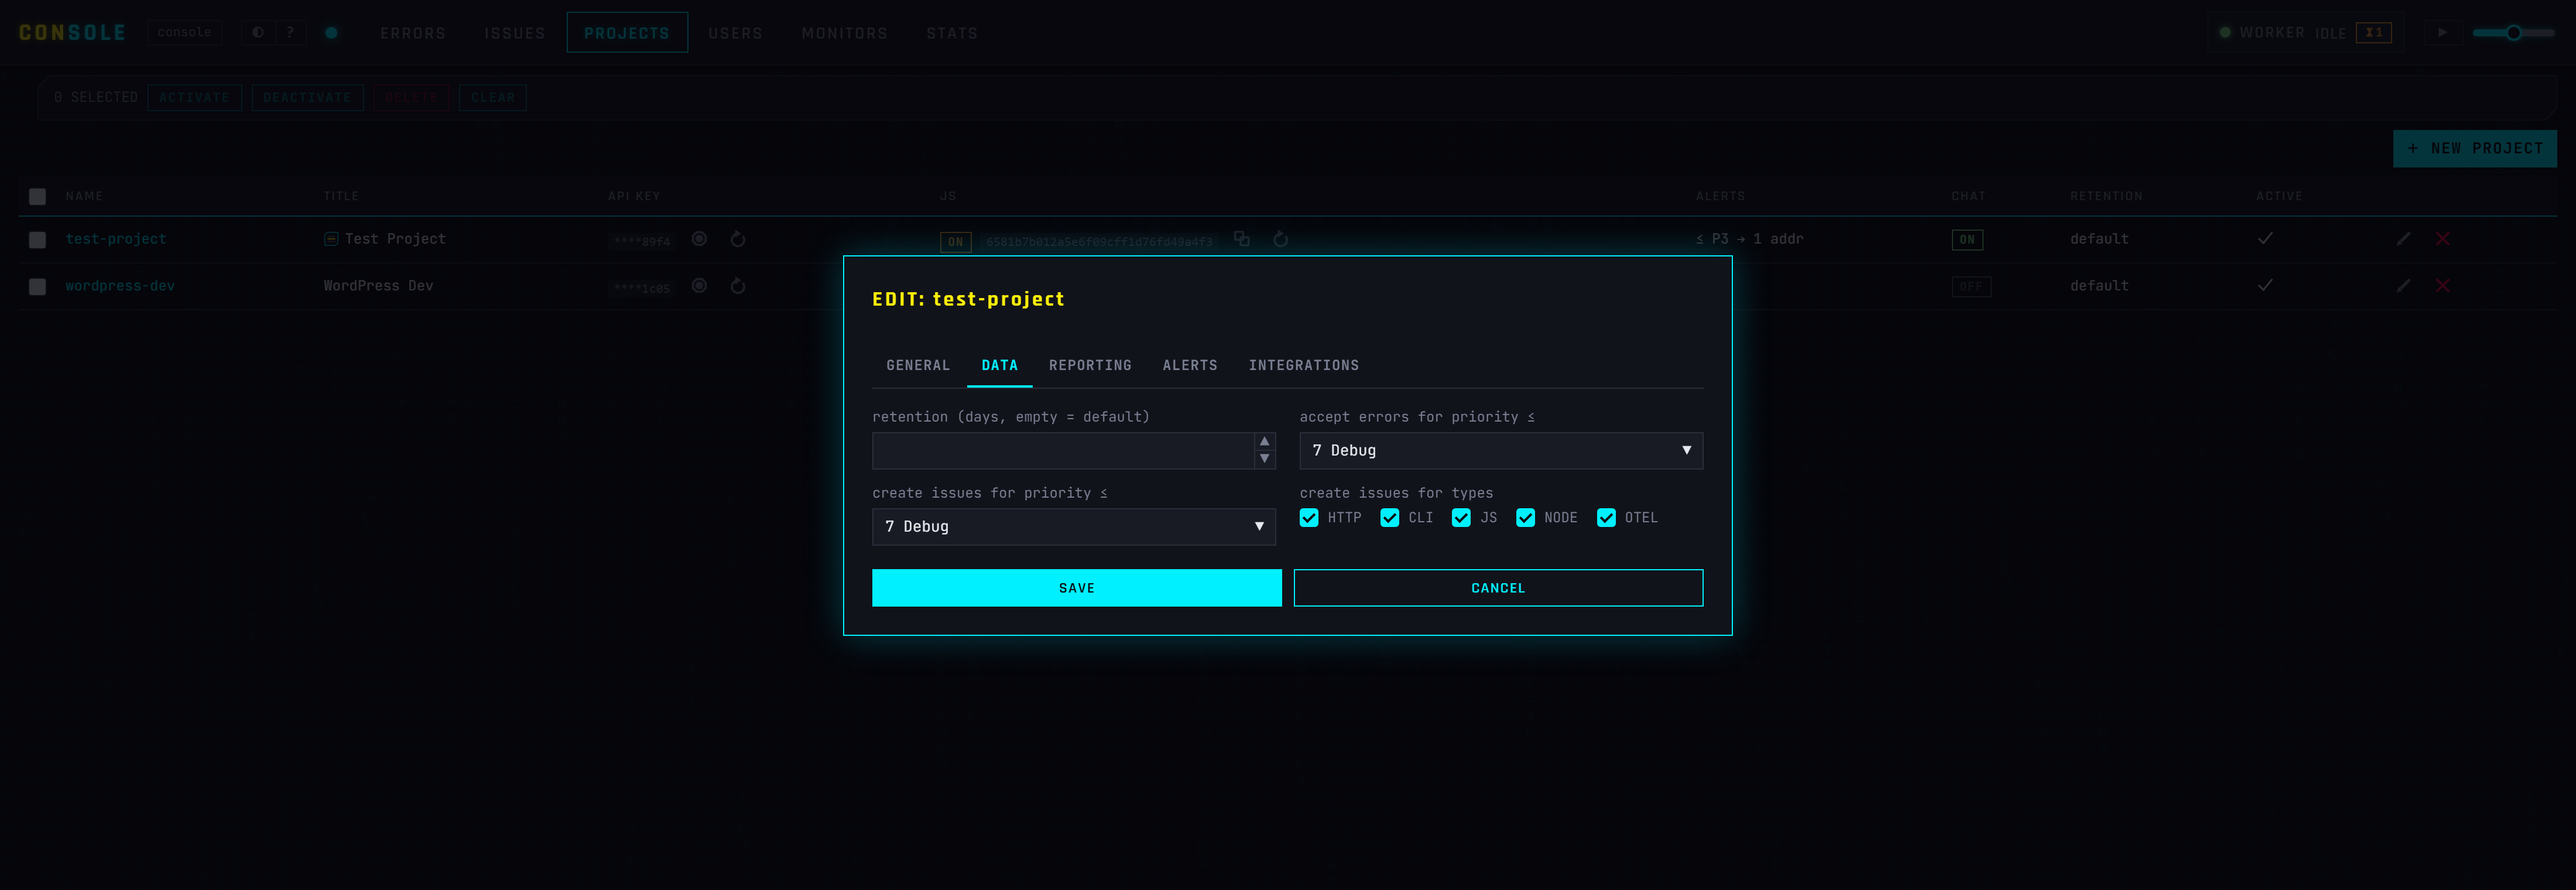
For each project, choose how serious an error must be before it becomes an issue, and which sources count — silence noisy browser warnings while never missing a real crash.
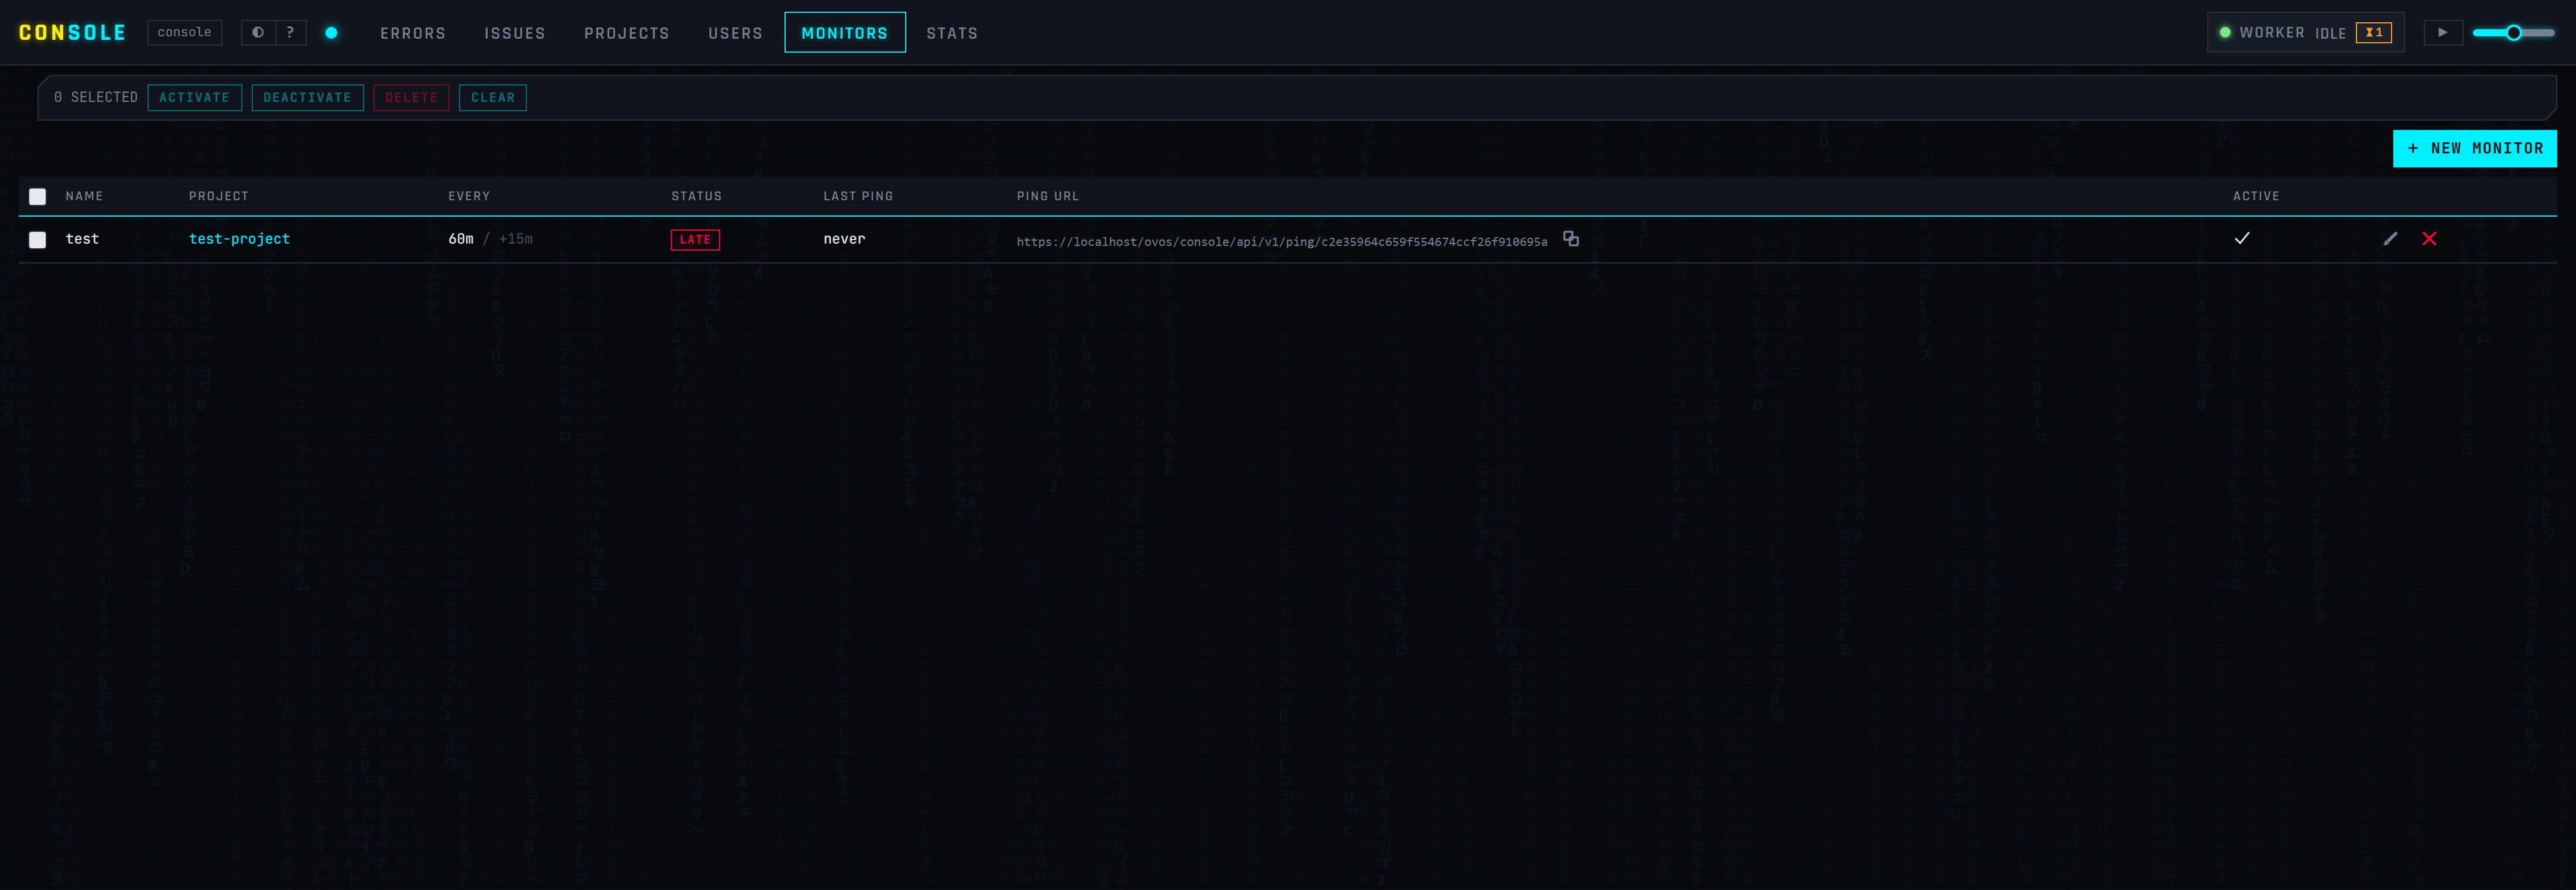
The console keeps an eye on your scheduled jobs and web pages. If a job stops running or a site goes down, you hear about it before your users do.
Get notified by email or chat the moment it matters — set per project, and throttled so one incident doesn't bury your team in messages.
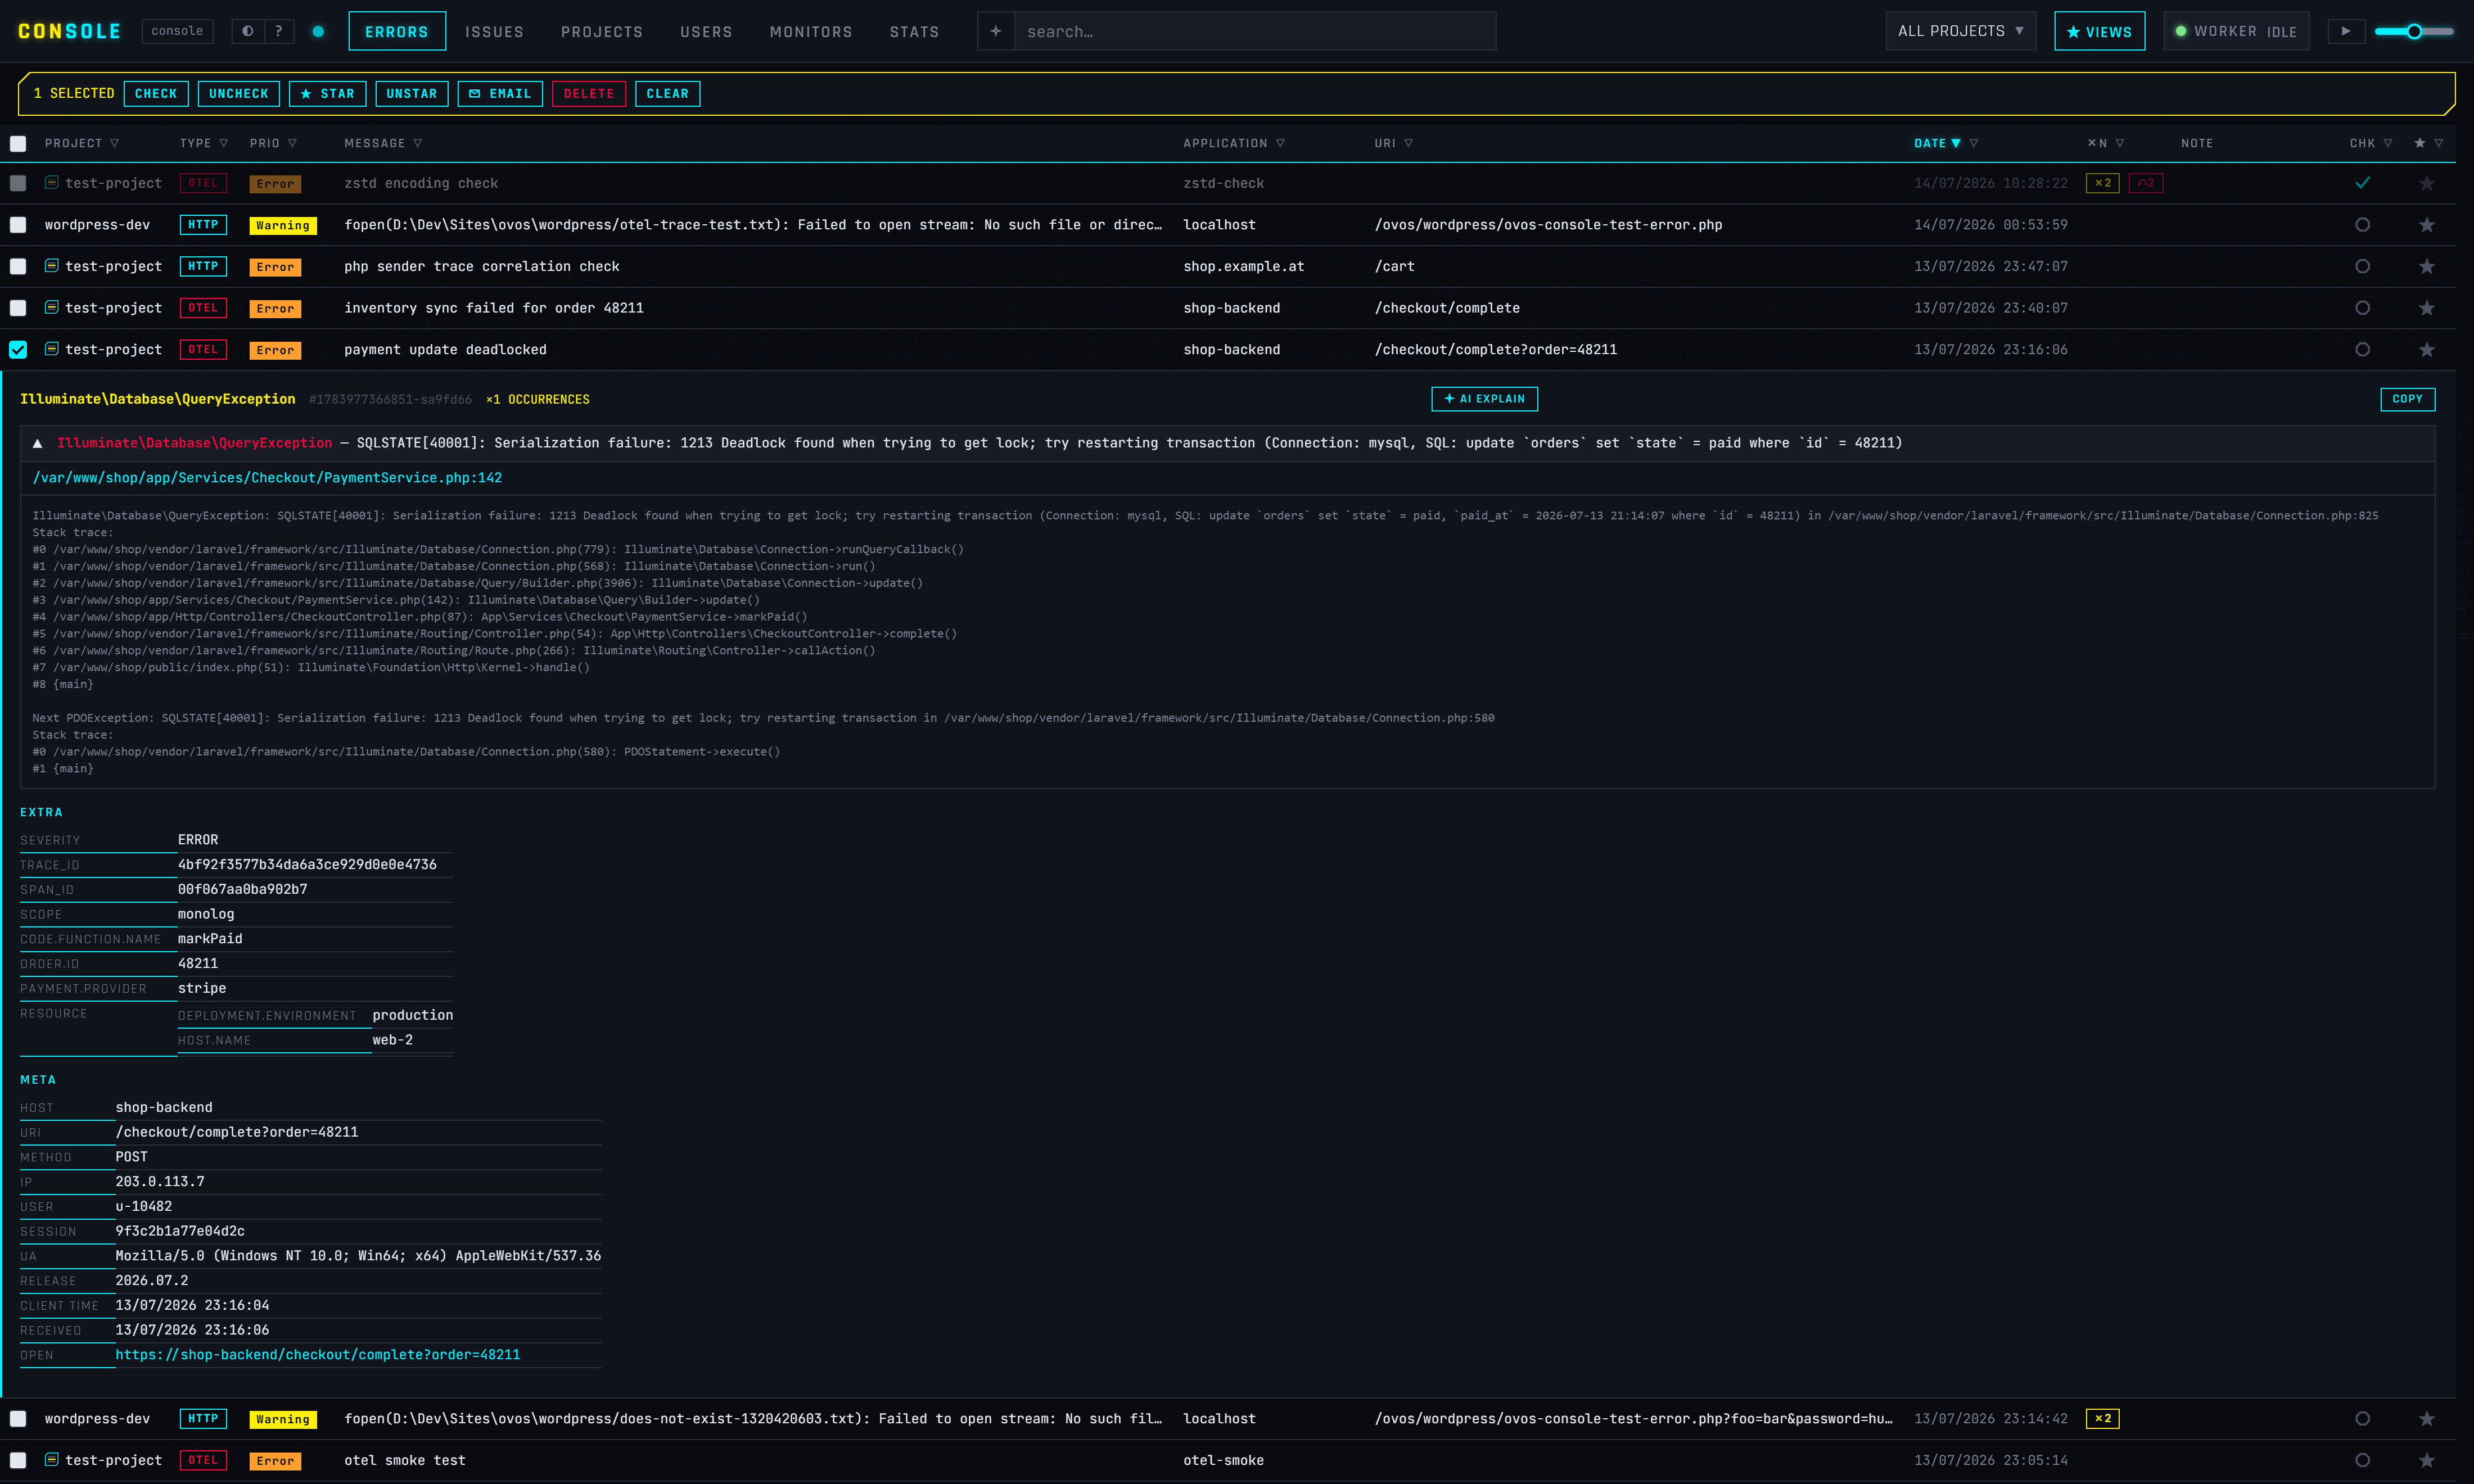
Point Claude or any AI assistant at the console — over the open MCP standard — and just ask: it can look up errors, open issues and read the details for you. Inside the console, ask a question in plain language, or click ◇ AI EXPLAIN on any error for an instant, plain-English explanation of what went wrong.
Clear a backlog quickly with the keyboard alone — resolve, mute, star or jump between views in a single keystroke, and act on a whole page at once.
Point your apps at your Redis. There is no third party in the path.
A PHP, Node.js, browser-JS or WordPress client, an OpenTelemetry collector — or a keyed API call — reports the error.
It hits a Redis Stream and is written to a RediSearch index.
The grid queries the index live; occurrences group into issues.
Monitors and priority rules fire email and chat notifications.
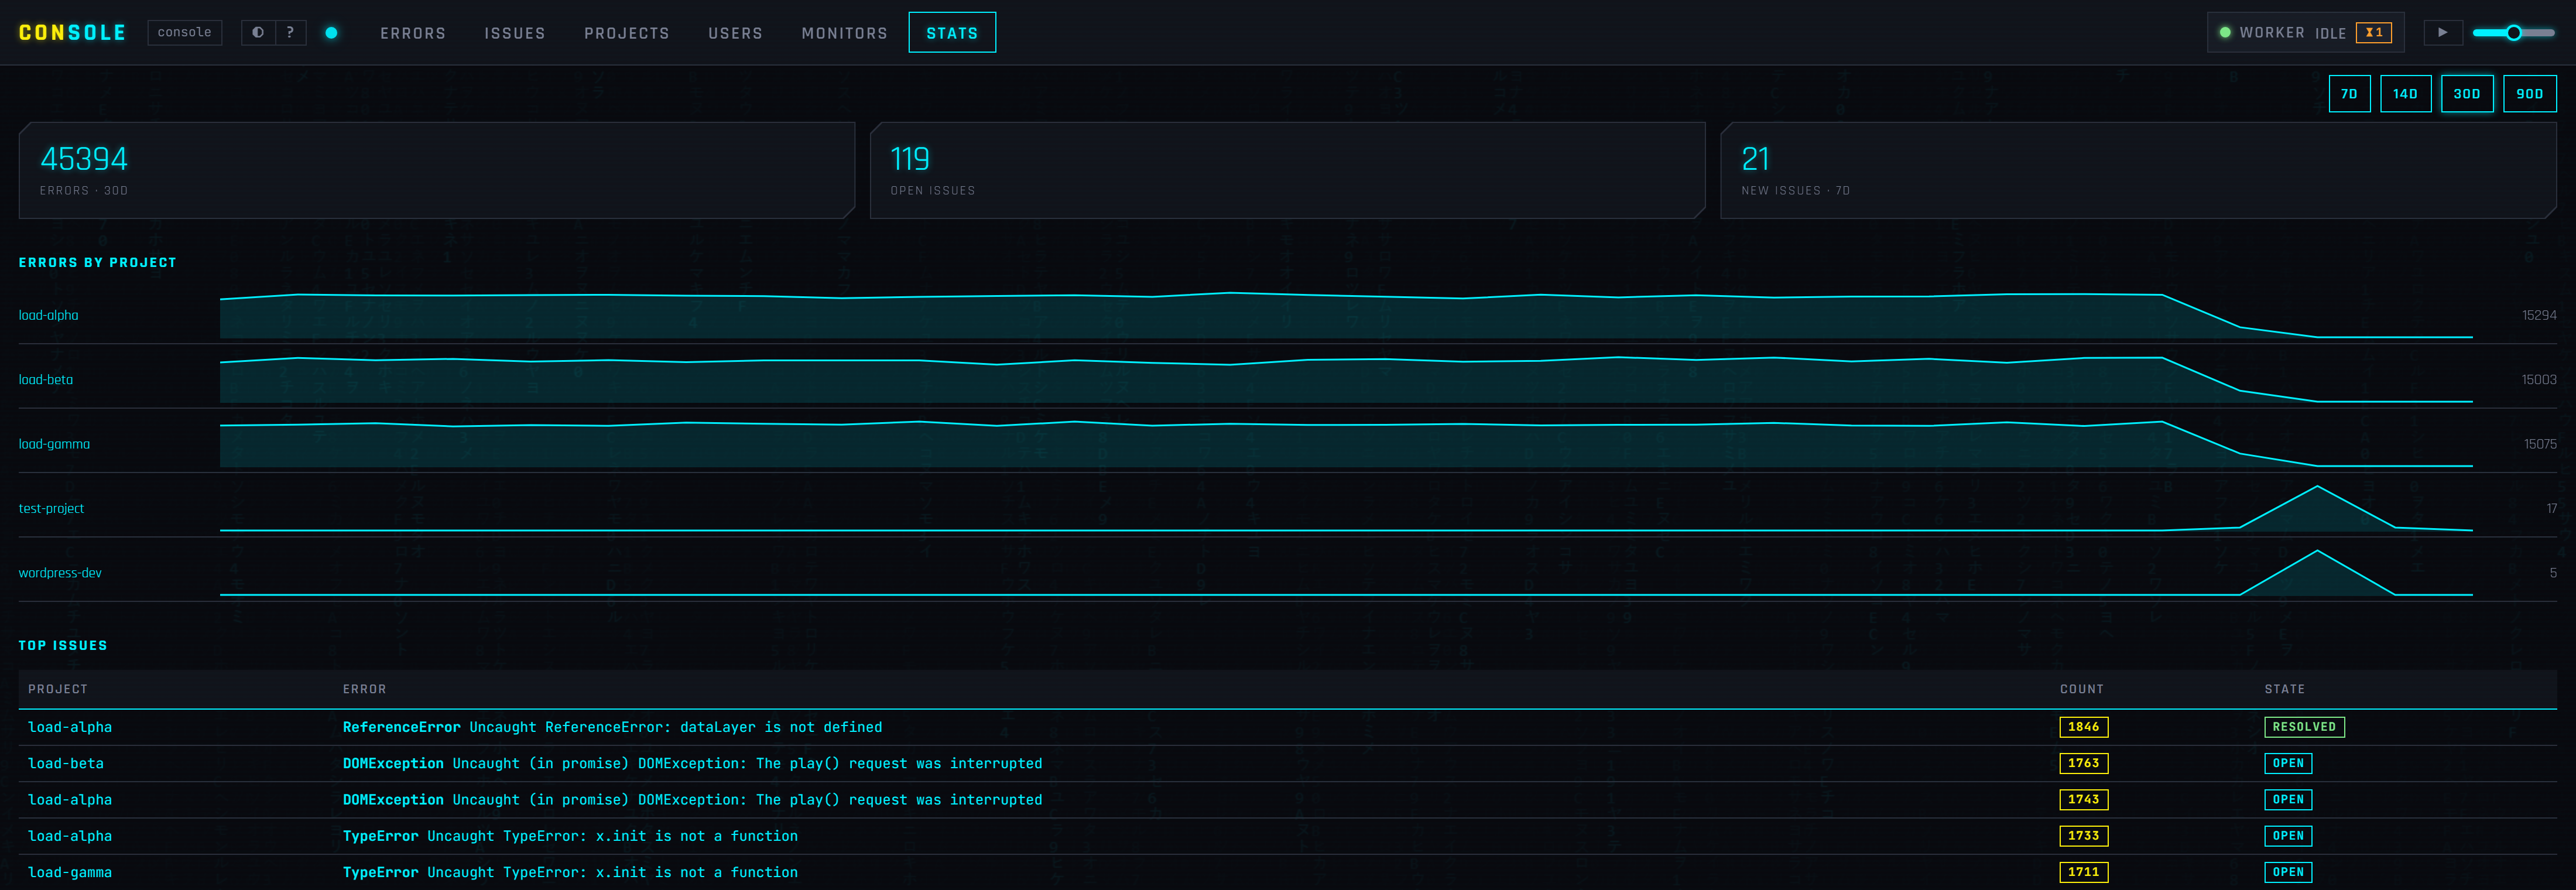
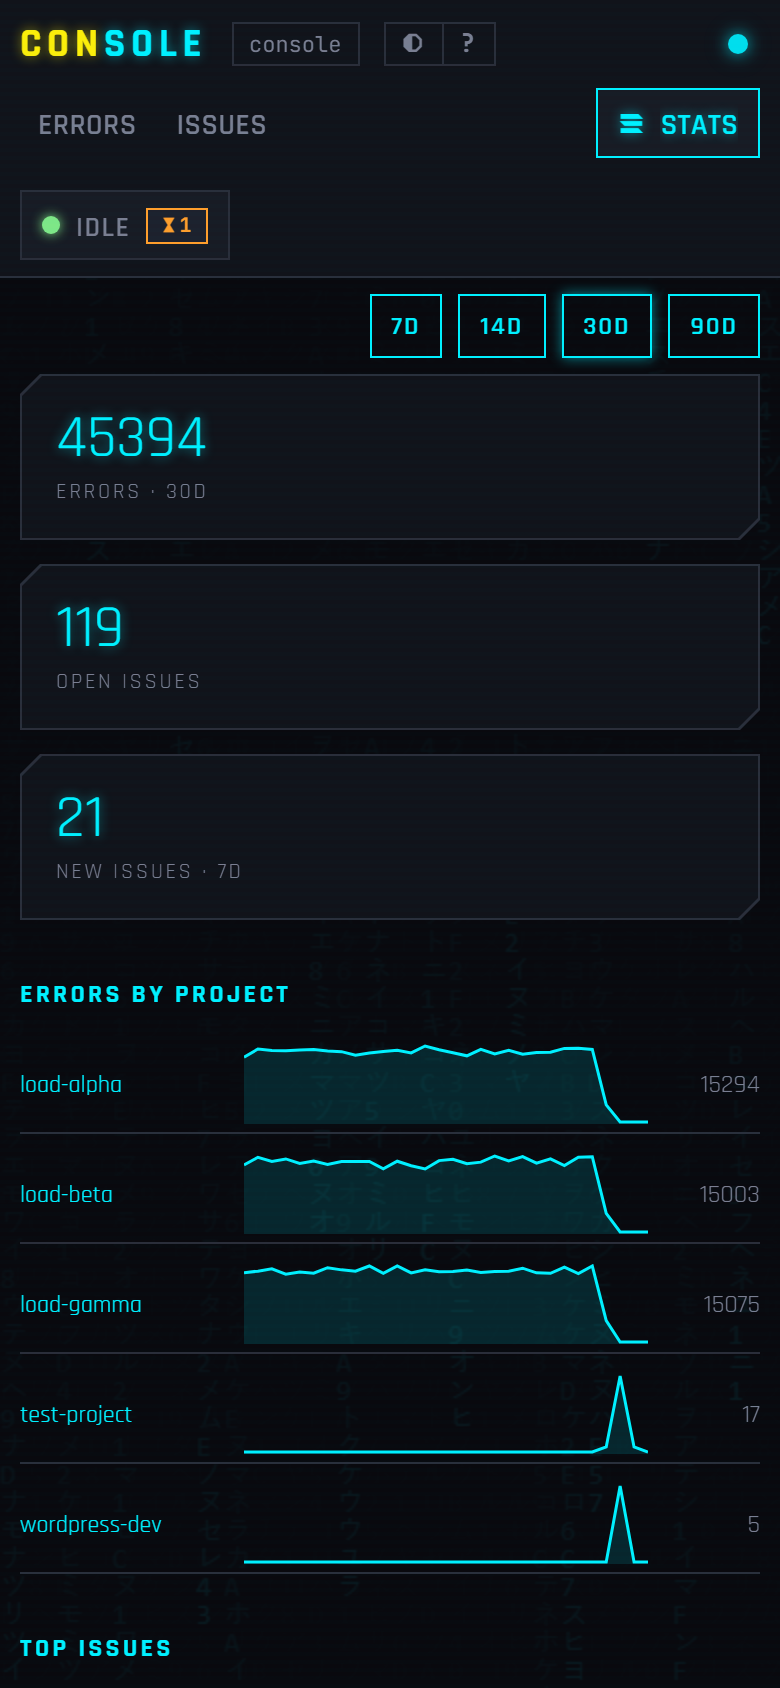
Real screens from a running instance — nothing mocked.
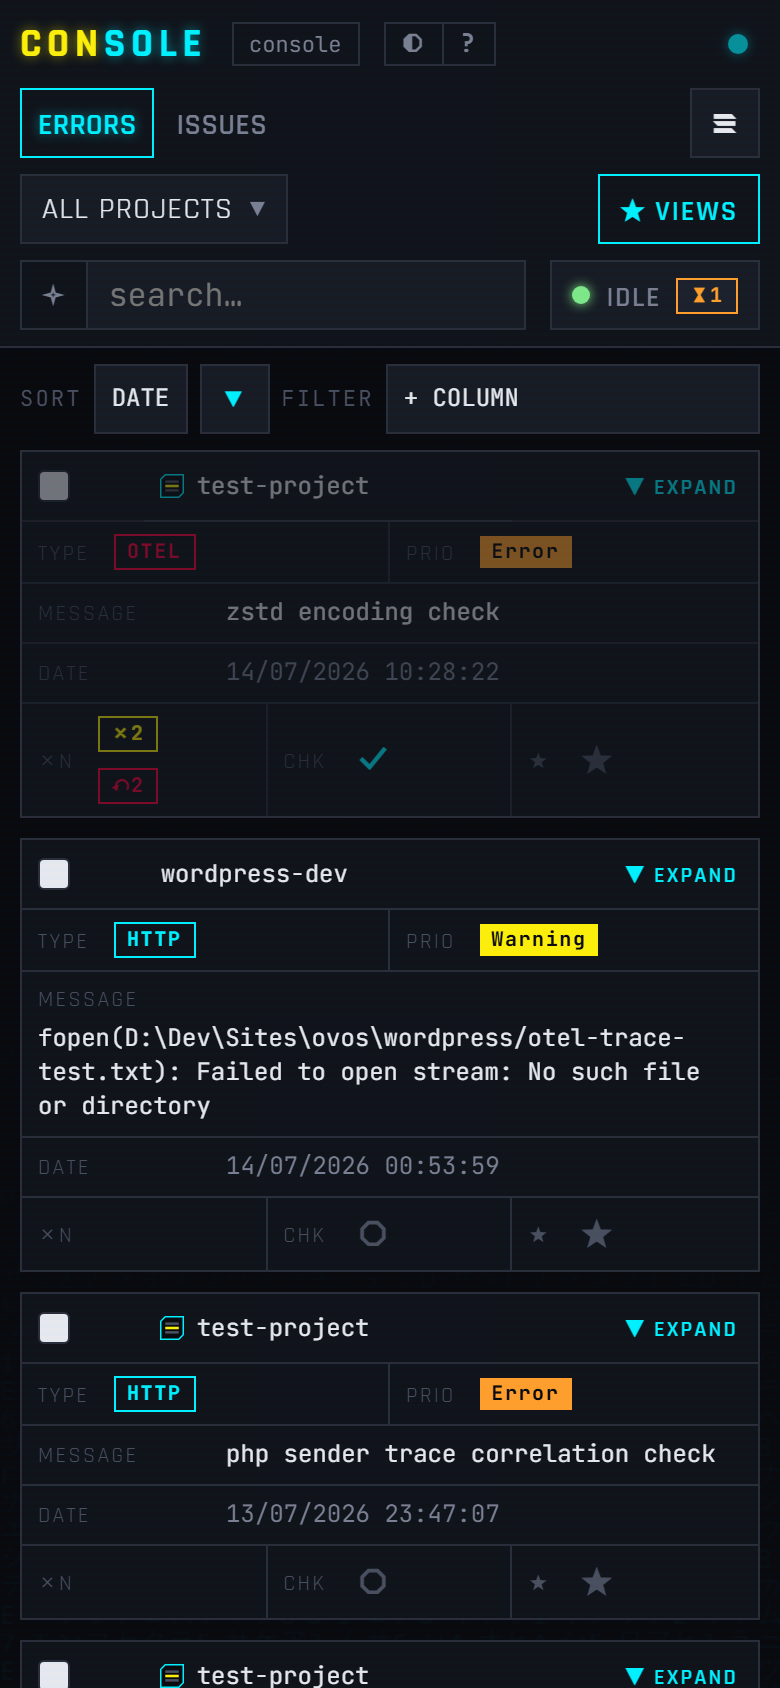
The same console, fully responsive — grids fold into labelled cards and the controls adapt to touch, so you can triage from anywhere.
One console, every project keyed and filtered separately — without a per-seat, per-event SaaS invoice that scales with your client list.
A self-hosted alternative to hosted error trackers: stack traces and user data stay on infrastructure you control.
Redis-Streams ingest shrugs off error storms; the app reports and moves on while the console indexes in the background.
Run it next to your apps on your own Redis stack. You own the data and the uptime.
View on GitHubPrefer not to run it yourself? We'll host and operate a private instance for you — from Vienna, in the EU, where your data stays.
Talk to us